

Flow metrics
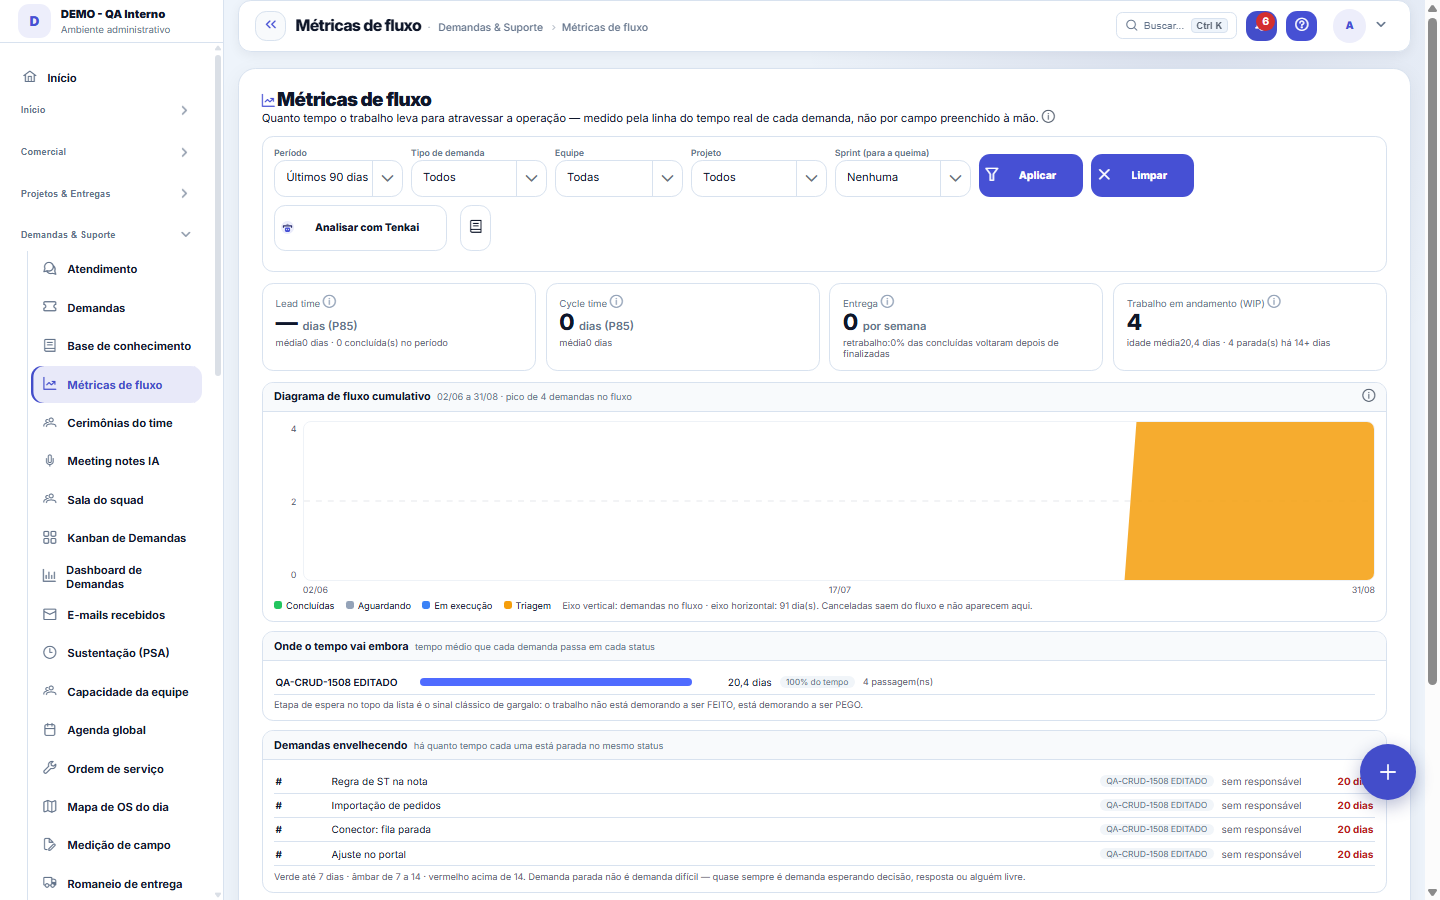
How long work takes to cross your operation — and where it stops along the way. Every number on this screen is rebuilt from the real timeline of each request: nothing is typed in.
The screen
The real screen, in the theme you picked above.
What you find on this screen
A portrait of the screen, read from the screen itself — it changes when the screen changes.
Available actions
ApplyClear
Form fields
Janela em diasJanela de dias analisada, que define o recorte de todas as métricas de fluxo.
Lead time (P85)Dias da abertura até a entrega no percentil 85, o prazo que se pode prometer.
Cycle time (P85)Dias de quando alguém começou até concluir, no percentil 85.
Entrega por semanaQuantas demandas o time conclui por semana em média.
RetrabalhoPercentual das concluídas que voltaram a ser trabalhadas depois de finalizadas.
Trabalho em andamento (WIP)Quantas demandas estão abertas em andamento neste momento.
Idade média do WIPMédia de dias que as demandas em andamento já esperam no fluxo.
Dias por etapaTempo médio que cada demanda passa parada em cada etapa do fluxo.
Fatia do tempo totalFatia do tempo total de travessia consumida por aquela etapa.
Velocidade médiaMédia de pontos entregues por sprint.
Variação da velocidadeQuanto a velocidade oscila entre sprints; menos variação significa mais previsibilidade.
Restam hoje na sprintPontos que ainda faltam concluir na sprint escolhida em relação ao ideal do dia.
Start here
What it's for
Answering with data the three questions every manager keeps an eye on: what deadline can I promise? where's the bottleneck? is the team delivering more or less than before? It serves as a ready-made agenda for the daily and the retrospective.
Rules
Lead time vs. cycle time
Lead time counts from the OPENING to completion — it's the time the client feels. Cycle time counts from when someone actually STARTED to completion — it's the time the team controls. The difference between the two is queue: open work waiting for someone to pick it up. When the lead time is much bigger than the cycle time, the problem isn't execution speed, it's too much work open at the same time.
Promise by the P85, not the average
The average hides the bad cases. The P85 says "85 out of every 100 demands were completed within this time" and it's a value that ACTUALLY happened — it's the one used for agreeing on a deadline. Promising by the average means missing the deadline in nearly half the cases.
If the queue is growing, the panel warns you
There's a fixed relationship between queue and lead time: crossing time = work in progress ÷ delivery rate. When this calculation comes out much higher than the measured lead time, more work is coming in than going out — and in that scenario, finishing what's already open shortens the deadline faster than any attempt to speed up.
Frequently asked questions
Why some demands don't have a measured stage
The screen reads status CHANGES. A demand that was opened and completed without ever passing through an intermediate status enters the counts, but doesn't have a time per stage or a cycle time — and the screen states in how many of the completed items the cycle was measured, instead of faking a complete average. Items without a point estimate count as 1 in velocity: a team that doesn't estimate can still see its own pace.
Was this article helpful?
In the same module: Today's work21
ConversationsThe conversation hub: reply to portal customers, talk to colleagues (internal chat), and in groups. Everythin…Base de conhecimentoOs artigos que respondem antes de o chamado existir — e o número que mostra quantos chamados isso evitou.InboxYour personal inbox to jot down anything without classifying it at the moment of capture.Team ceremoniesWhere the team's meetings are recorded — planning, daily, review and retrospective — with the agreed duration…ChamadosOs atendimentos de sustentação dos seus clientes, com o relógio do SLA, a previsão calculada e as ações da li…Ticket dashboardManagement view of the service desk: SLA, queue by status and type, workload by owner, and resolution time.TicketsDay-to-day operational cockpit: bugs, improvements, support, and tasks — with SLA, owner, contract consumptio…Company documentA certificate, policy, power of attorney or license with the validity at the center: status, notice to the pe…
Tenka Academy
Explore the AcademyStep-by-step learning paths for your industry, inside the platform.