

Accountant's kit
Gathers the reports and files the accountant downloads at once to close the month. The kit is assembled from what exists at the current closing: generating it before closing delivers a partial result — close first.
The screen
The real screen, in the theme you picked above.
What you find on this screen
A portrait of the screen, read from the screen itself — it changes when the screen changes.
Available actions
Reassess
The list shows
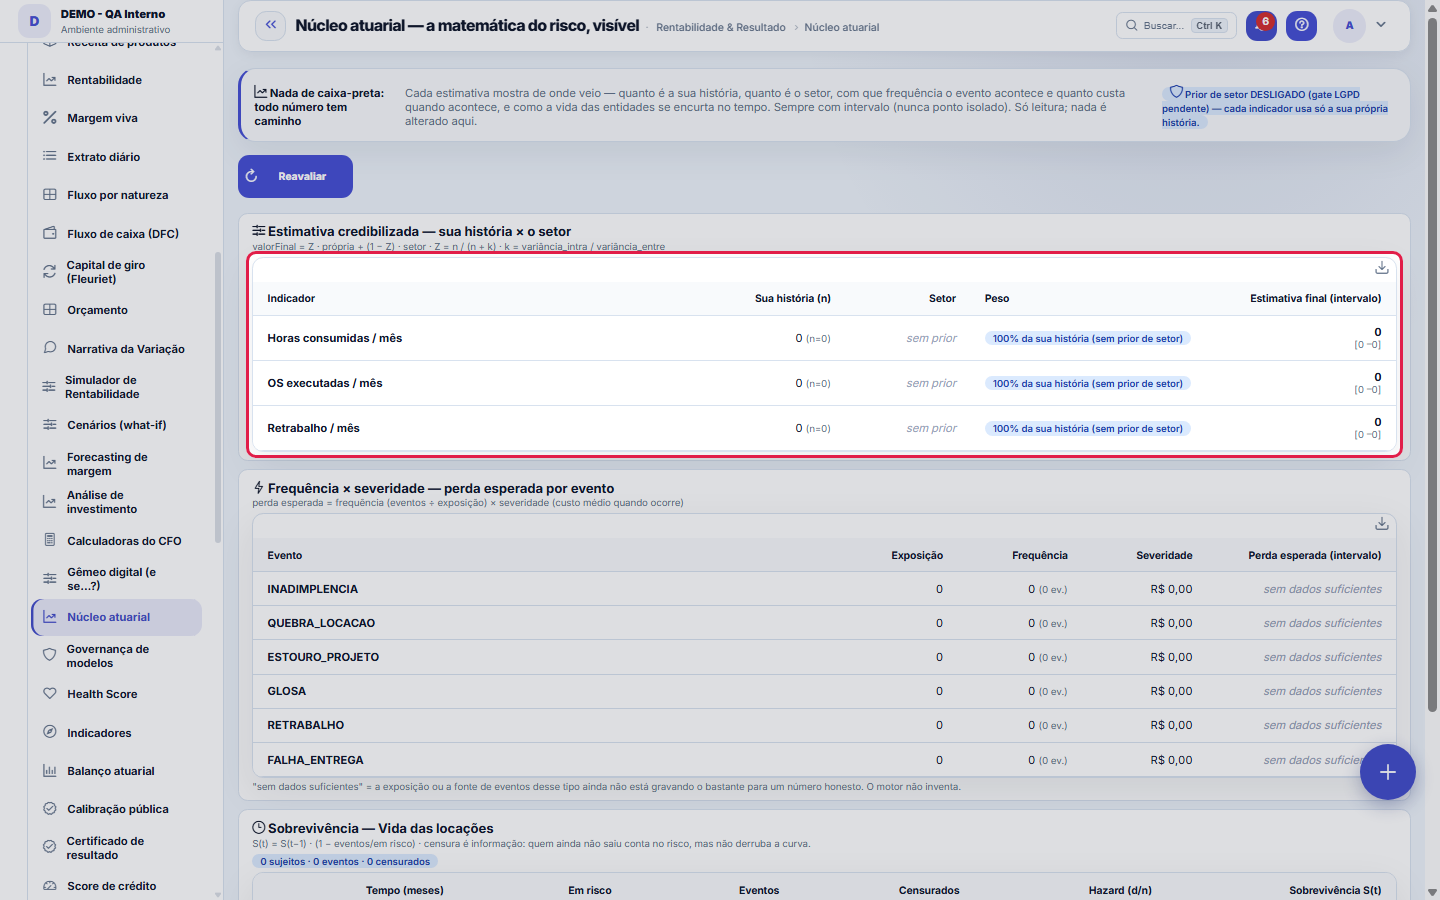
IndicatorYour story (n)SectorWeightFinal estimate (range)EventExposureFrequencySeverityExpected loss (range)Time (months)At risk+4
Form fields
Tipo de exposiçãoO que está exposto ao risco: contrato, cliente, apólice, item.
DenominadorSobre que base a frequência é medida. Denominador errado inverte a conclusão.
Quantidade expostaO tamanho da exposição no denominador escolhido.
OcorrênciaQuando o fato aconteceu.
ConhecimentoQuando a empresa soube. A diferença em relação à ocorrência é o atraso de aviso (IBNR).
CompetênciaMês em que a exposição é contada no triângulo.
Start here
What this screen is
The mathematics of risk, VISIBLE (no black box). By indicator: the credibility-weighted estimate — how much comes from your history and how much from the industry (Bühlmann–Straub), with the weight stated in text; the frequency × severity breakdown of events (default, rental breakdown, project overrun, disallowance, rework, delivery failure) — how often it happens and how much it costs when it happens, and the product (expected loss); and the survival curve (Kaplan–Meier, handling censored data) for customer churn, equipment life and retention. Every number has an interval (never an isolated point) and the baseline it came from. Read-only.
How often do these numbers refresh?
An "expected loss" number alone hides the information that changes the decision. "Happens often and costs little" calls for a process adjustment; "happens rarely and costs a fortune" calls for a reserve or insurance — and both can yield exactly the same expected loss. That is why this screen always shows the FREQUENCY (out of how many chances the problem happened) and the SEVERITY (how much it cost, on average, when it happened) separately, and only then the product of the two.
How to
Ocorrência, conhecimento e competência: três datas diferentes
In the exposure record, three dates coexist and they are not the same thing: Occurrence is when the event happened in the world; Knowledge is when the company learned of it; Period is the month it belongs to in the calculation. The Exposure type says what is being counted (customer, contract, project), and the Denominator with the Exposed quantity form the base on which the frequency is calculated — without a correct denominator, the frequency comes out inflated or diluted.
Rules
Why does it say "not enough data" instead of a number?
Default counts receivables that fell due within the window and were not paid. Disallowance counts the disallowances recorded in the period, by the disallowed amount. Equipment breakdown counts the maintenance jobs opened due to breakdown, by the maintenance cost. Project overrun counts the periods in which the hours consumed exceeded the contract's allowance, valued at its hourly rate. Rework counts the hours logged as WARRANTY — that is, redone for free. Delivery failure counts the service order that CAME BACK: a new order from the same customer and the same equipment shortly after a previous one was closed.
Is my data exposed here?
Rework is time you redid without charging, so there is no charged amount to use as cost. Fill in "Cost of a rework hour" in Settings → Parameters (Actuarial group) and the expected loss from rework gets a value in reais; without it, the platform shows how many times it happened and leaves the cost at zero, without making anything up. The same group has "Days in which a new SO counts as a return" (default 30), which defines what the platform considers a delivery failure in your line of business.
How often do these numbers refresh?
An event has no data when one of the two halves is missing: no occurrence recorded in the period, or no exposure captured to serve as the denominator. It is not a defect and does not mean zero risk — it means the platform has no basis to assert anything, and prefers to say so rather than show a fragile number. Exposure is captured by the operations themselves: closing field SOs, calculating support, reading the hour meter, issuing claim forms, completing production orders.
Sobrevivência: o que significa "censurado"
In the Kaplan–Meier curve, censored is the subject who left the observation window without having experienced the event — the customer who remains active, the equipment that still works. It does not count as an event nor is it discarded: it contributes to the "at risk" until the moment it was last seen. That is what avoids the classic bias of measuring churn only with those who have already left. The header shows the total of subjects, events and censored; each line shows the hazard (d/n) and the cumulative survival S(t).
Frequently asked questions
Which question this screen answers
What the expected risk of the operation is — and how much of it comes from your own history versus the industry's experience. The screen shows three blocks, all read-only: the credibility-weighted estimate (Bühlmann–Straub) with the weight stated in text, the frequency × severity breakdown with the expected loss in reais, and the survival curve (Kaplan–Meier) with S(t) by period. Every number comes with an interval and with the n it came from — no isolated points.
Was this article helpful?
In the same module: Simulate before deciding16
Investment AnalysisAssesses whether a project/contract/purchase pays for the cost of capital and creates value. Discounts the pr…Team journeyWho's most engaged: adoption by role, the week's scoreboard, and who needs a nudge.CFO CalculatorsThree everyday financial decisions solved on the spot: how to amortize a loan, compare rates on different bas…CenáriosTeste a decisão antes de tomá-la e veja o efeito no resultado e no caixa.Scenarios (what-if)Compare up to 3 futures side by side: hiring, losing a client, adjusting price — and see the effect on result…Comparar cenáriosCaminhos lado a lado, com o pior caso à mostra.Dossiê de investimentoO parecer que um comitê exigiria, em uma página.Margin ForecastingShows where your margin is heading: projects revenue, cost, and margin for the next 6 months based on the rea…
Tenka Academy
Explore the AcademyStep-by-step learning paths for your industry, inside the platform.