

Inventory dashboard
The health of your stock in one place: balance and value per item and warehouse, items below the minimum (stockout), turnover (issues ÷ stock), and the ABC curve by value consumed — where the money in your inventory lives.
The screen
The real screen, in the theme you picked above.
What you find on this screen
A portrait of the screen, read from the screen itself — it changes when the screen changes.
Available actions
Reassess
The list shows
FamilynBrier (model)Brier (baseline)GainVerdictStatusOpen forecastsWhat's missingBands (expected → observed, n)BandForecast+6
Form fields
ModeloNome do modelo cuja calibração está sendo divulgada.
MétodoTécnica de cálculo declarada publicamente para este modelo.
VersãoVersão a que os números publicados se referem.
BrierErro médio da previsão medido contra o que aconteceu de fato.
BaselineReferência de comparação: o que se acertaria sem modelo nenhum.
Calibrado emData da calibração que sustenta os números desta página.
SituaçãoSe a calibração está válida, vencida ou revisada.
Base legalNorma que obriga ou ampara a publicação destes números.
ObservaçãoRessalvas declaradas junto com a calibração publicada.
Start here
What this screen is
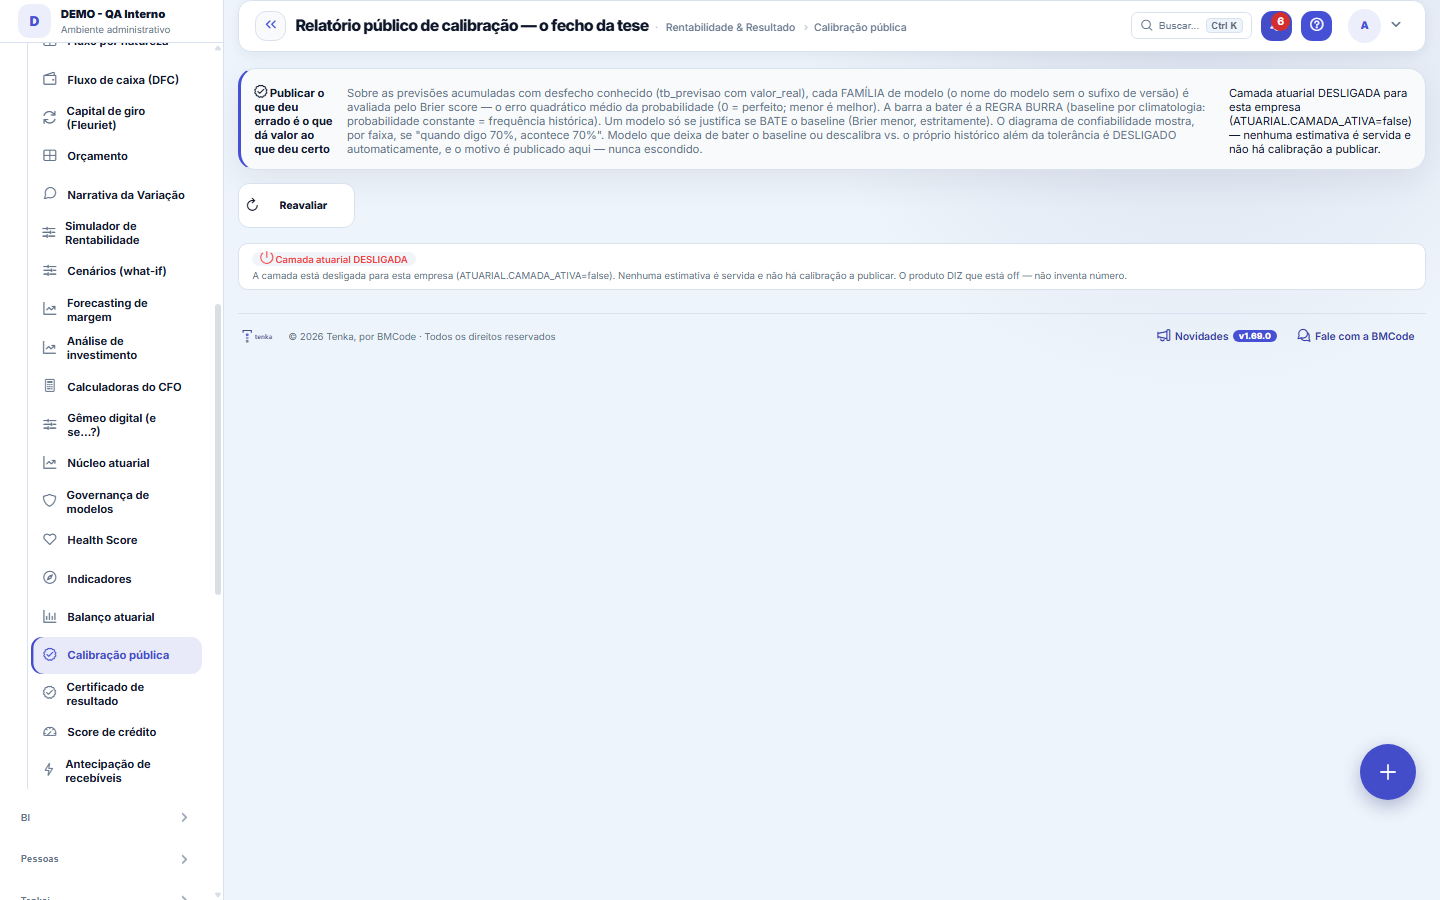
The PUBLIC CALIBRATION REPORT — the capstone of the thesis. Over the accumulated forecasts with a known outcome, it shows PER MODEL FAMILY (SCORE_CREDITO, PCLD, CHURN…) the model's Brier score against the DUMB RULE (baseline by historical average): the model is only justified if it beats the baseline. It brings the reliability diagram ("when I say 70%, does it happen 70%?") and, 🔴 with no makeup, the list of models that were TURNED OFF — for drift or for not beating the baseline — each with the reason in plain view. Publishing what went wrong is what gives value to what went right: it is the same results contract that Tenka demands of digital employees, applied to itself. Read-only.
O que esta tela responde
Which of the platform's forecasts you can trust. Every time the system makes a guess about your business — the risk of a customer not paying, how much a contract will bill, how cash will look over the next 13 weeks, how many hours the team will consume, how much the funnel should close — that guess is recorded with a date and a deadline. When the deadline expires, the platform goes and fetches what ACTUALLY happened and compares. This screen is the scoreboard of that comparison, published in full: what it got right and what it got wrong.
Por que a barra a bater é a "regra burra"
A model is only justified if it beats the simplest possible forecast — the historical average, with no intelligence at all. That is what the "baseline" column shows. If the model does not beat the dumb rule, it is adding nothing, and the platform turns it off automatically and publishes the reason here. The number used in the comparison (Brier) is the mean error of the probability: the LOWER, the better; zero would be perfection.
Rules
"Sem amostra ainda" não é erro — é o prazo que ainda não venceu
Each type of forecast has its own deadline for being checked: team load is checked in one week, cash in thirteen, contract revenue in six months. Until the deadline of a family's first forecast expires, it appears in the "families that do not yet have a scoreboard" list, with how many forecasts are already recorded and waiting. A company that has just started using the platform will see almost all of them there — and that is the correct behavior: better to say there is no sample than to show a hit rate calculated on top of two observations.
Barra sem amostra mínima não é publicada
A calibração só mostra o número quando há amostra suficiente para ele não identificar ninguém; abaixo disso a barra fica "sem amostra ainda" — não é erro, é a proteção do dado de cada empresa.
Frequently asked questions
Which question this screen answers
Which of my models can I trust — and which were turned off, and why? Over the accumulated forecasts with a known outcome, the screen shows per model family (SCORE_CREDITO, PCLD, CHURN…) the model's Brier score against the dumb rule (baseline by historical average): the model is only justified if it beats the baseline. It brings the reliability diagram — when the model says 70%, does it happen 70%? — and the list of models turned off for drift or for losing to the baseline, each with the reason in plain view.
Was this article helpful?
In the same module: The balance sheet and the proof2
Tenka Academy
Explore the AcademyStep-by-step learning paths for your industry, inside the platform.