

Experiments (A/B)
Test price, cadence, and discount policy on YOUR operation with correct statistics — something no one delivers to SMBs. The POWER calculation tells you how many observations are needed to detect the minimum effect you care about (with your chosen alpha and power); SEQUENTIAL TESTING lets you follow…
The screen
The real screen, in the theme you picked above.
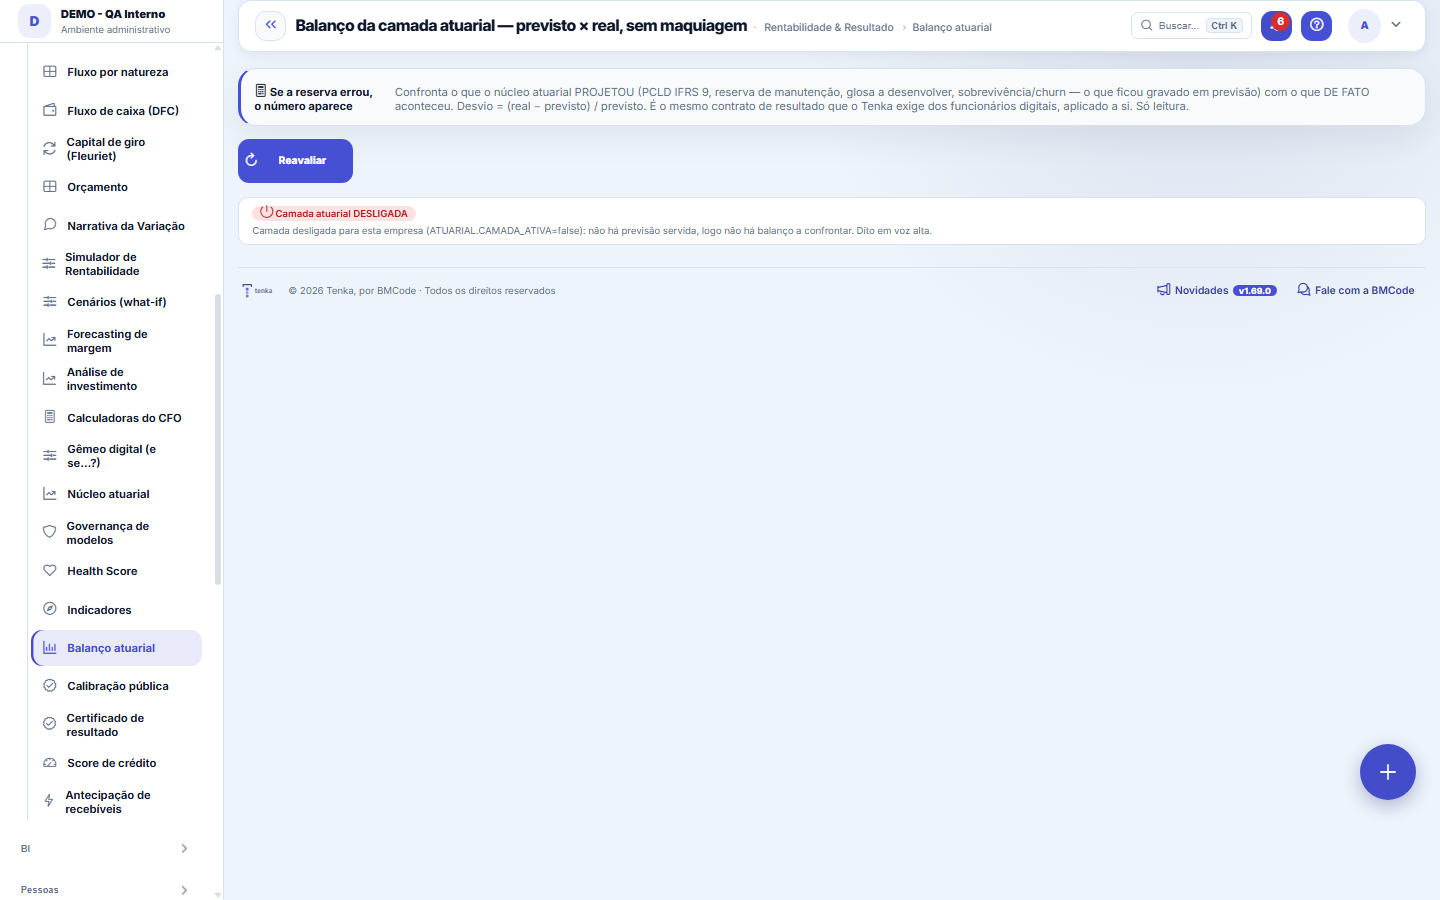
What you find on this screen
A portrait of the screen, read from the screen itself — it changes when the screen changes.
Available actions
Reassess
The list shows
FamilyForecastActualVarianceVerdict
Form fields
IndicadorQual número foi projetado: caixa, margem, capacidade. Define como o desfecho será medido.
ModeloQual modelo gerou a projeção. Comparar modelos no mesmo indicador é o que mostra quem acerta mais.
Projetado emQuando a projeção foi feita. Projeção antiga não se corrige, se compara.
Valor projetadoO número que o modelo disse que ia acontecer.
Limite inferiorPiso do intervalo de confiança. Abaixo dele o modelo errou para menos.
Limite superiorTeto do intervalo de confiança. Acima dele o modelo errou para mais.
Valor realizadoO que de fato aconteceu. Vazio significa que o horizonte ainda não fechou.
Desfecho emQuando o realizado foi apurado e a projeção pôde ser cobrada.
Horizonte (dias)Em quantos dias o resultado passa a ser observável. Cada indicador tem o seu prazo.
Start here
O que esta tela responde
What each model family projected, what actually happened, the deviation between the two and whether it fits within the declared tolerance.
What this screen is
THE ACTUARIAL LAYER BALANCE — forecast × actual, with no makeup. It confronts what the actuarial core models PROJECTED (PCLD IFRS 9 × actual loss, maintenance reserve × actual spend, projected disallowance × effective disallowance, forecast survival × observed churn — what was recorded as a forecast) with what ACTUALLY happened. Each line shows forecast, actual, percentage deviation = (actual − forecast) / forecast and the tolerance verdict. 🔴 If the reserve missed, the number appears marked as out — the balance does not smooth it. Read-only.
How to
Desvio persistente é assunto da governança de modelos
An isolated error is noise. An error in the same direction, month after month, is drift — and the place to handle it is the Model governance screen, re-evaluating or turning off the model in question.
Rules
What this screen answers
A reserve that missed appears marked as out of tolerance, without rounding and without justifying. That is the point of the screen: a balance that only shows hits is not a balance, it is advertising — and its first victim is whoever trusts the numbers to decide.
Frequently asked questions
Which question this screen answers
It answers a single question: did what the actuarial layer FORECAST match what HAPPENED — and where did it miss? Each line confronts the recorded projection (PCLD IFRS 9, maintenance reserve, projected disallowance, forecast survival) with the actual, calculates the percentage deviation = (actual − forecast) / forecast and gives the tolerance verdict. If the reserve missed, the line appears marked as out — the balance does not smooth it. The screen is read-only: model correction is done by model governance.
Was this article helpful?
In the same module: The balance sheet and the proof2
Tenka Academy
Explore the AcademyStep-by-step learning paths for your industry, inside the platform.